Gantt Charts
Identify critical stages to ensure your project progresses

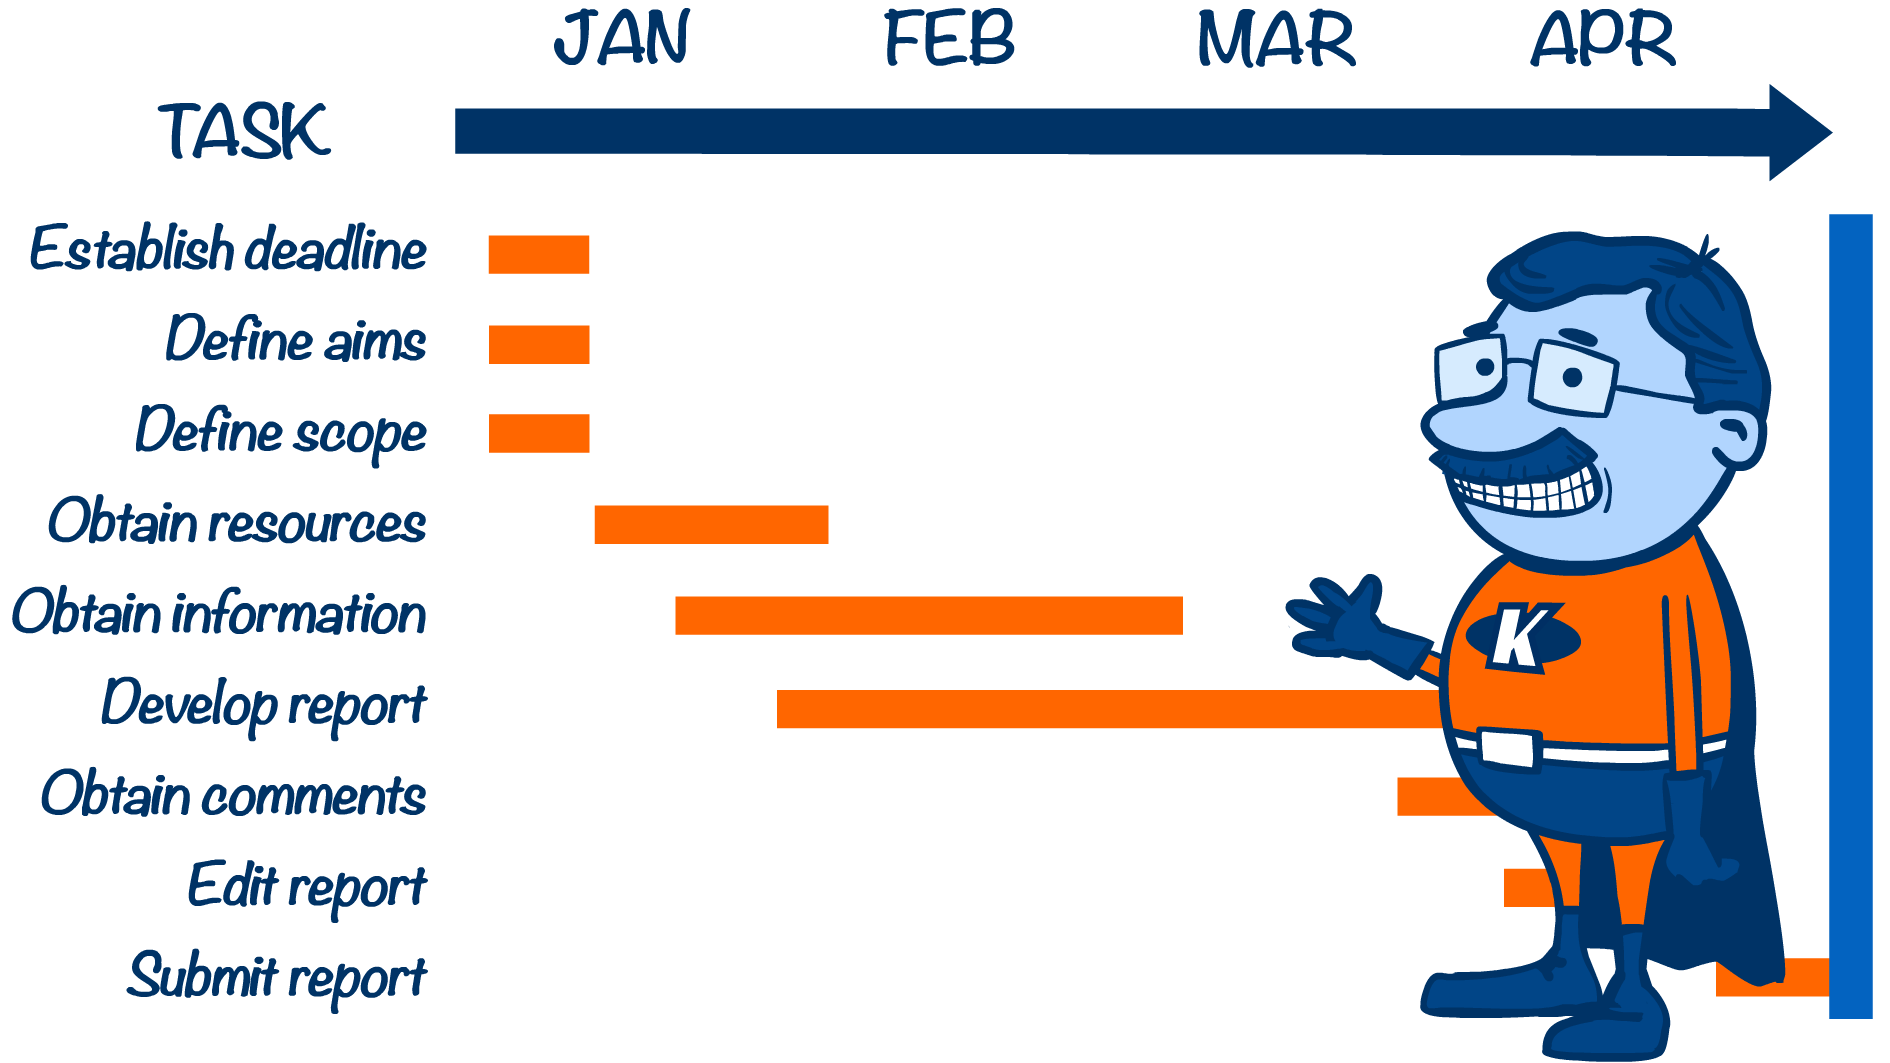
Gantt charts are basically another form of timeline that emphasises how tasks and resources depend on related tasks and achievements. They are often routinely used in engineering projects but they apply equally to any project.
Software packages for producing Gantt charts are available to handle large projects. They present the progress of the project as a series of bars along a timeline, with each bar representing a different activity. Such software helps identify critical stages that have to be accomplished before other stages can commence, and slack periods that are non-critical and give opportunities for catching up where aspects have been delayed.
For more simple projects undertaken by small teams, a simple timeline approach will be sufficient. It shows which things must precede which other things and which things can be done together. When projects get larger and more complicated and depend upon collaboration between larger numbers of people, the effort and formality of a Gantt chart is worth considering.
Pin It on Pinterest